library(ggplot2)
data <- data.frame(
x = c(1, 2, 3, 4),
y = c(10, 20, 30, 40),
group = c("A", "A", "B", "B")
)
color_var <- "group"
ggplot(data, aes(x = x, y = y, color = !!as.name(color_var))) +
geom_point()
ggplot(data, aes(x = x, y = y, color = get(color_var))) +
geom_point()
ggplot(data, aes(x = x, y = y, color = !!sym(color_var))) +
geom_point()
ggplot(data, aes(x = x, y = y, color = .data[[color_var]])) +
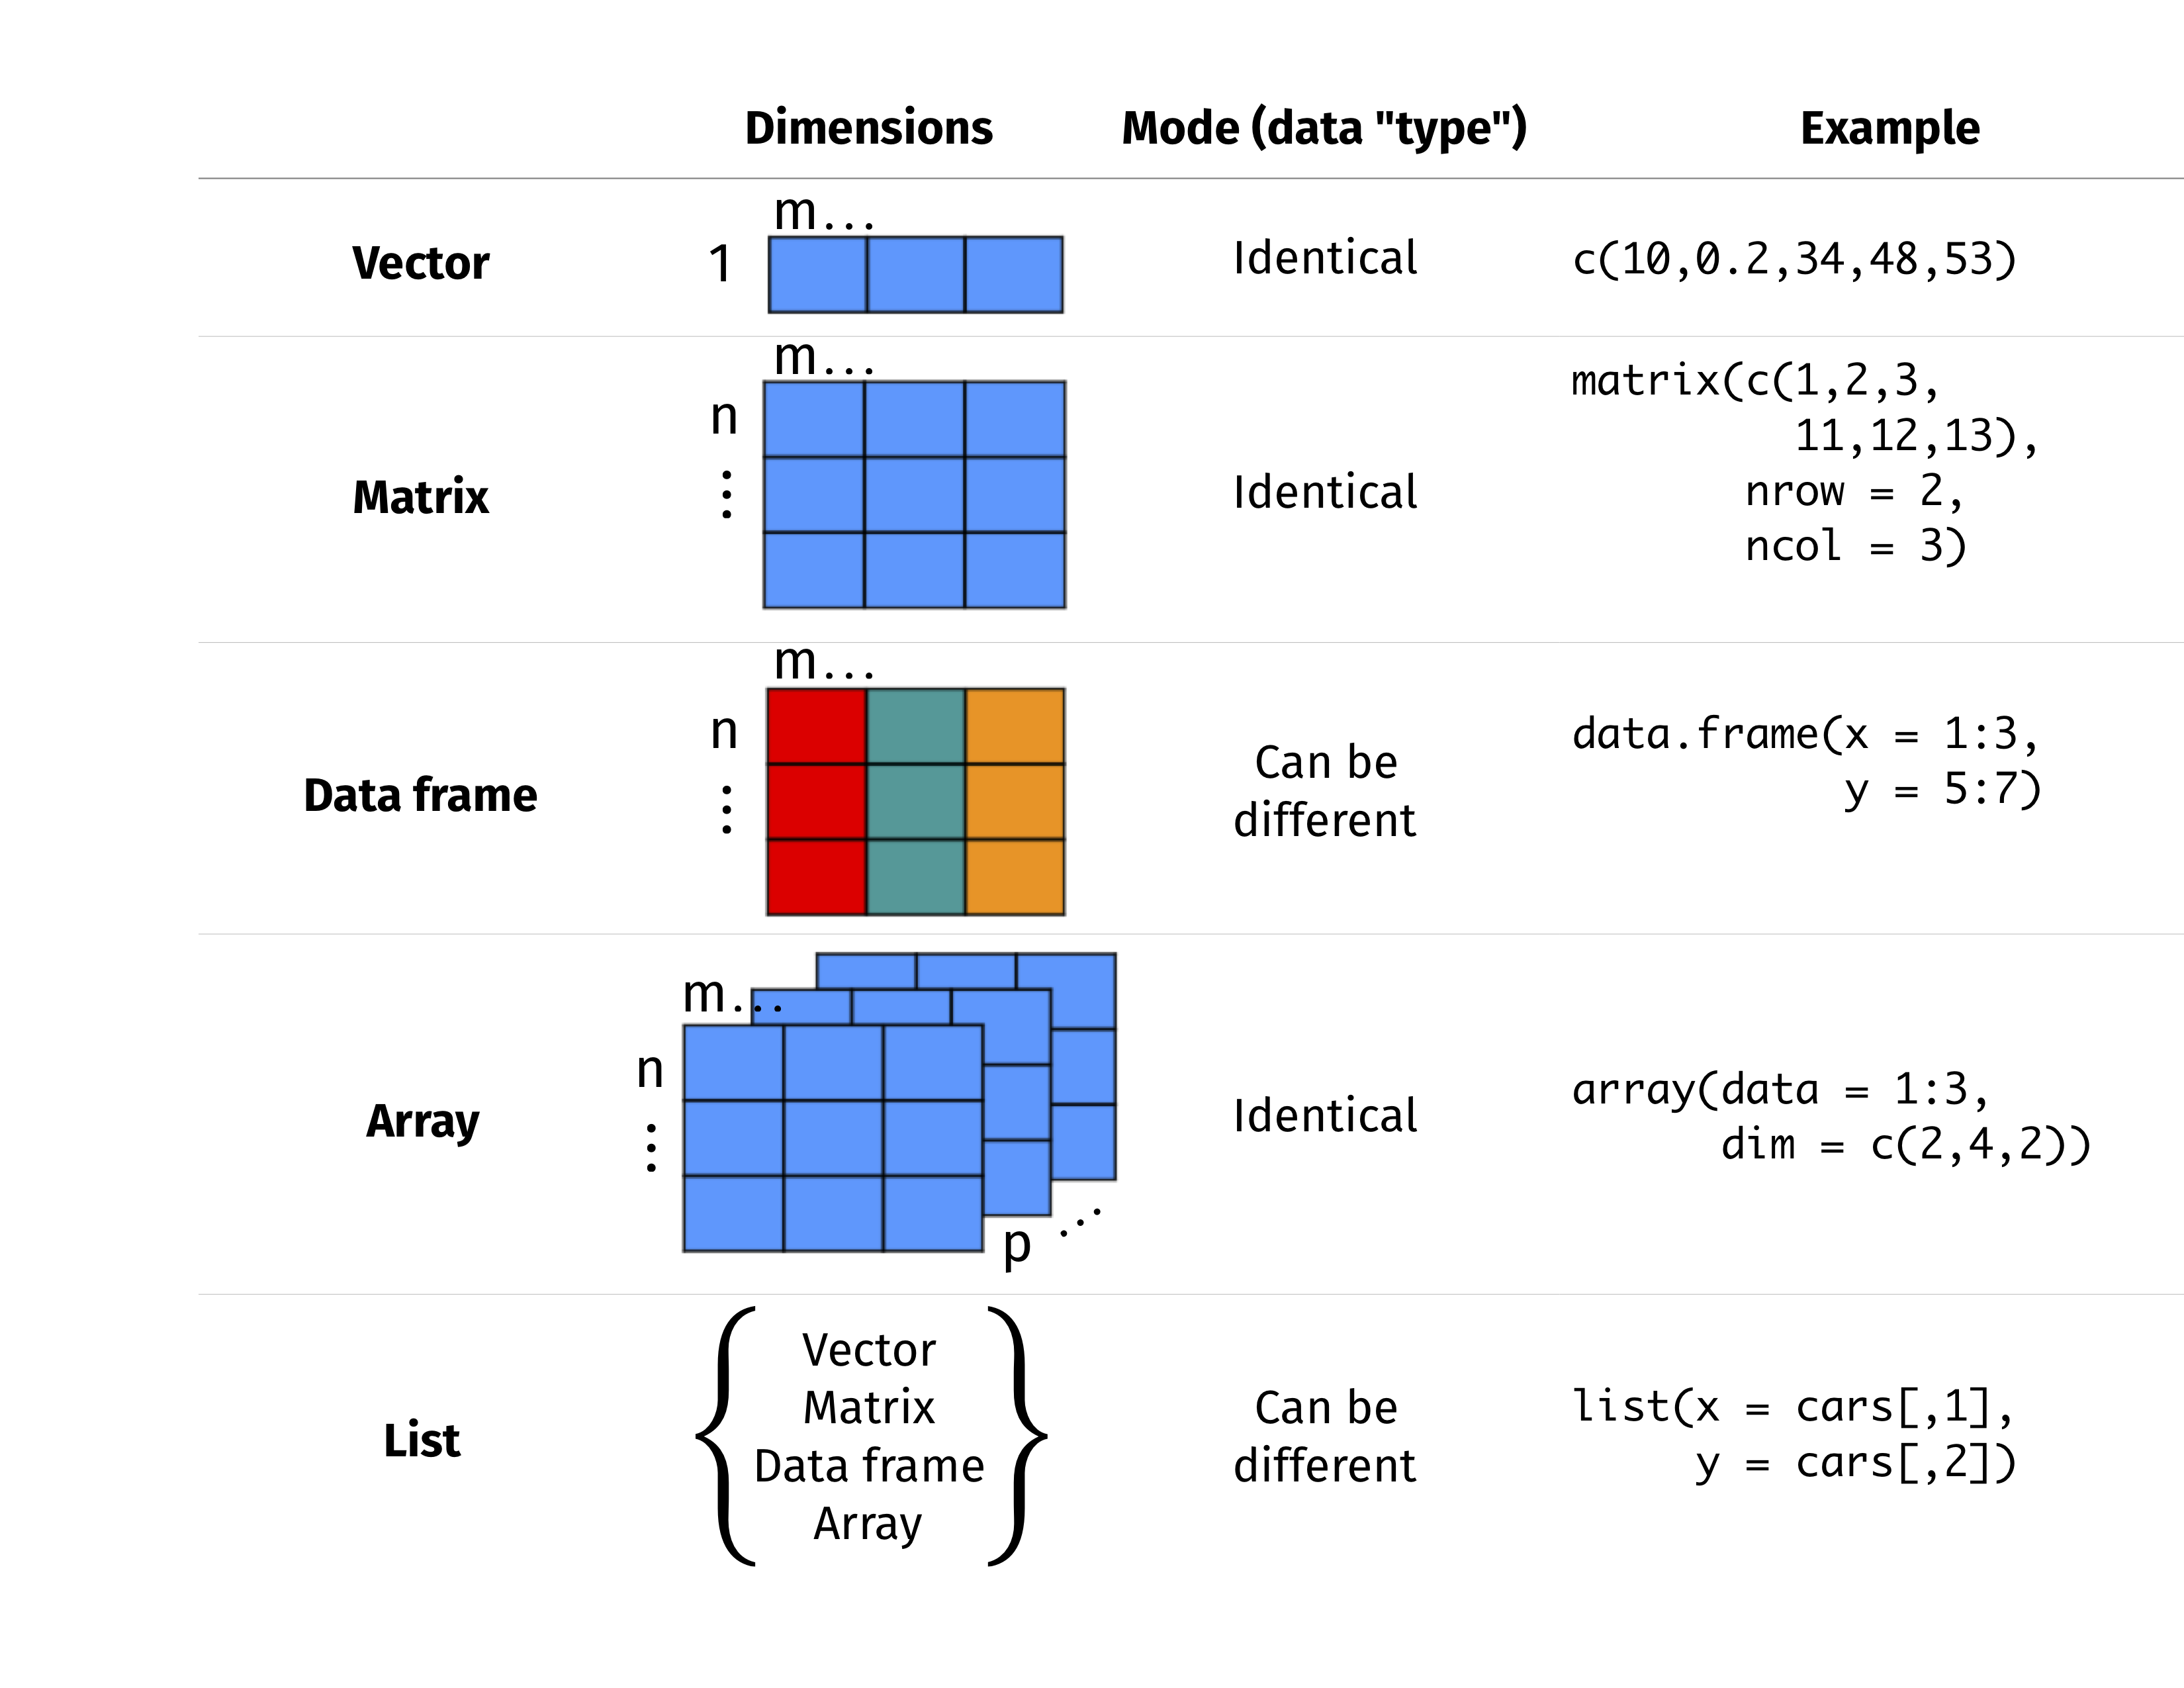
geom_point()Data Structure
General Functions
.libPaths()                      # Show library paths
dir()                            # Show the directory
getwd()                          # Check working directory
setwd()                          # Change working directory
data()                           # Load built-in dataset
view()                           # View the entire dataset
tail()                           # Just show the last 6 rows
class()                          # Check the class of an R object
str()                            # Display internal structure of an R object
length()                         # Give length of a vector
dim()                            # View the number of rows and columns of a matrix or a data frame
names()                          # List names of variables in a data frame
set.seed()                       # Generate random number seed to make sure the results do not change.
ls()                             # list the variables in the workspace
rm()                             # remove the variable from workspace
rm(list = ls())                  # remove all the variables from the workspace
list.files()                     # List the filename under specific directory
.libPaths()                      # R installation site
help(package="")                 # Check the functions of R library
system.file(package=“dagdata”)   # Extract the location of package
colnames(installed.packages())   # list the installed packages
Coding Practice
- Variables = my_variable or myVariable
- Functions = RunThisStuffs() or run_this_stuffs()
- A function should not be longer than one screen
- Constants = CONSTANTS
- Use 4 spaces (and not tab) for indentations
- Always writing documentation above function definition
- Avoid using for loop, learn lapply and vector operations
- Never ever use hard-coded variables in functions
-
### ======to divide function blocks -
### ------to divide parts in a function - Name and style code consistently
-
rm(list =ls())andgc()to tidy up its memory - Don’t save a session history
- Keep track of
sessionInfo()in project folder - Use version control
Variable Repacement
Common method to do the variable replacement in ggplot2:
!!as.name()get()!!sym().data[[]]
VSCode Setup
Remote Server Settings:
{
    "r.alwaysUseActiveTerminal": true,
    "r.bracketedPaste": true,
    "r.helpPanel.cacheIndexFiles": "Global",
    "r.plot.useHttpgd": true,
    "r.rmarkdown.chunkBackgroundColor": "",
    "r.rterm.option": [
        // "--r-binary=/home/zhonggr/miniforge3/envs/renv/bin/R",
        "--no-save",
        "--no-restore"
    ],
    "r.rpath.linux": "/home/zhonggr/miniforge3/envs/renv/bin/R",
    "r.rterm.linux": "/home/zhonggr/miniforge3/envs/renv/bin/radian"
}
{
"r.bracketedPaste": true,
"r.alwaysUseActiveTerminal": true,
"r.plot.useHttpgd": true,
"r.rterm.linux": "${userHome}/miniforge3/envs/renv/bin/radian",
"r.rpath.linux": "${userHome}/miniforge3/envs/renv/bin/R",
"r.rterm.mac": "${userHome}/miniforge3/envs/renv/bin/radian",
"r.rpath.mac": "${userHome}/miniforge3/envs/renv/bin/R",
"r.rterm.option": [
"--no-save", // Optional: Prevent saving workspace
"--no-restore", // Optional: Prevent restore workspace
"--no-site-file", // Optional: Avoid loading site-wide R profile
"--r-binary=${userHome}/miniforge3/envs/renv/bin/R"
],
"r.libPaths": [
"${userHome}/miniforge3/envs/renv/lib/R/library"
],
"r.plot.useHttpgd": true,
"[r]": {
"editor.defaultFormatter": "REditorSupport.r"
},
"files.associations": {
"*.rmd": "rmd"
},
}