---
title: "Barplot with negative and positive value"
date: 2023-03-11
categories:
- r
- barplot
image: plot.png
---
```{r setup, include=FALSE}
knitr::opts_chunk$set(
# fig.width = 6,
# fig.height = 3.8,
fig.align = "center",
fig.retina = 3,
# out.width = "85%",
collapse = TRUE
)
```
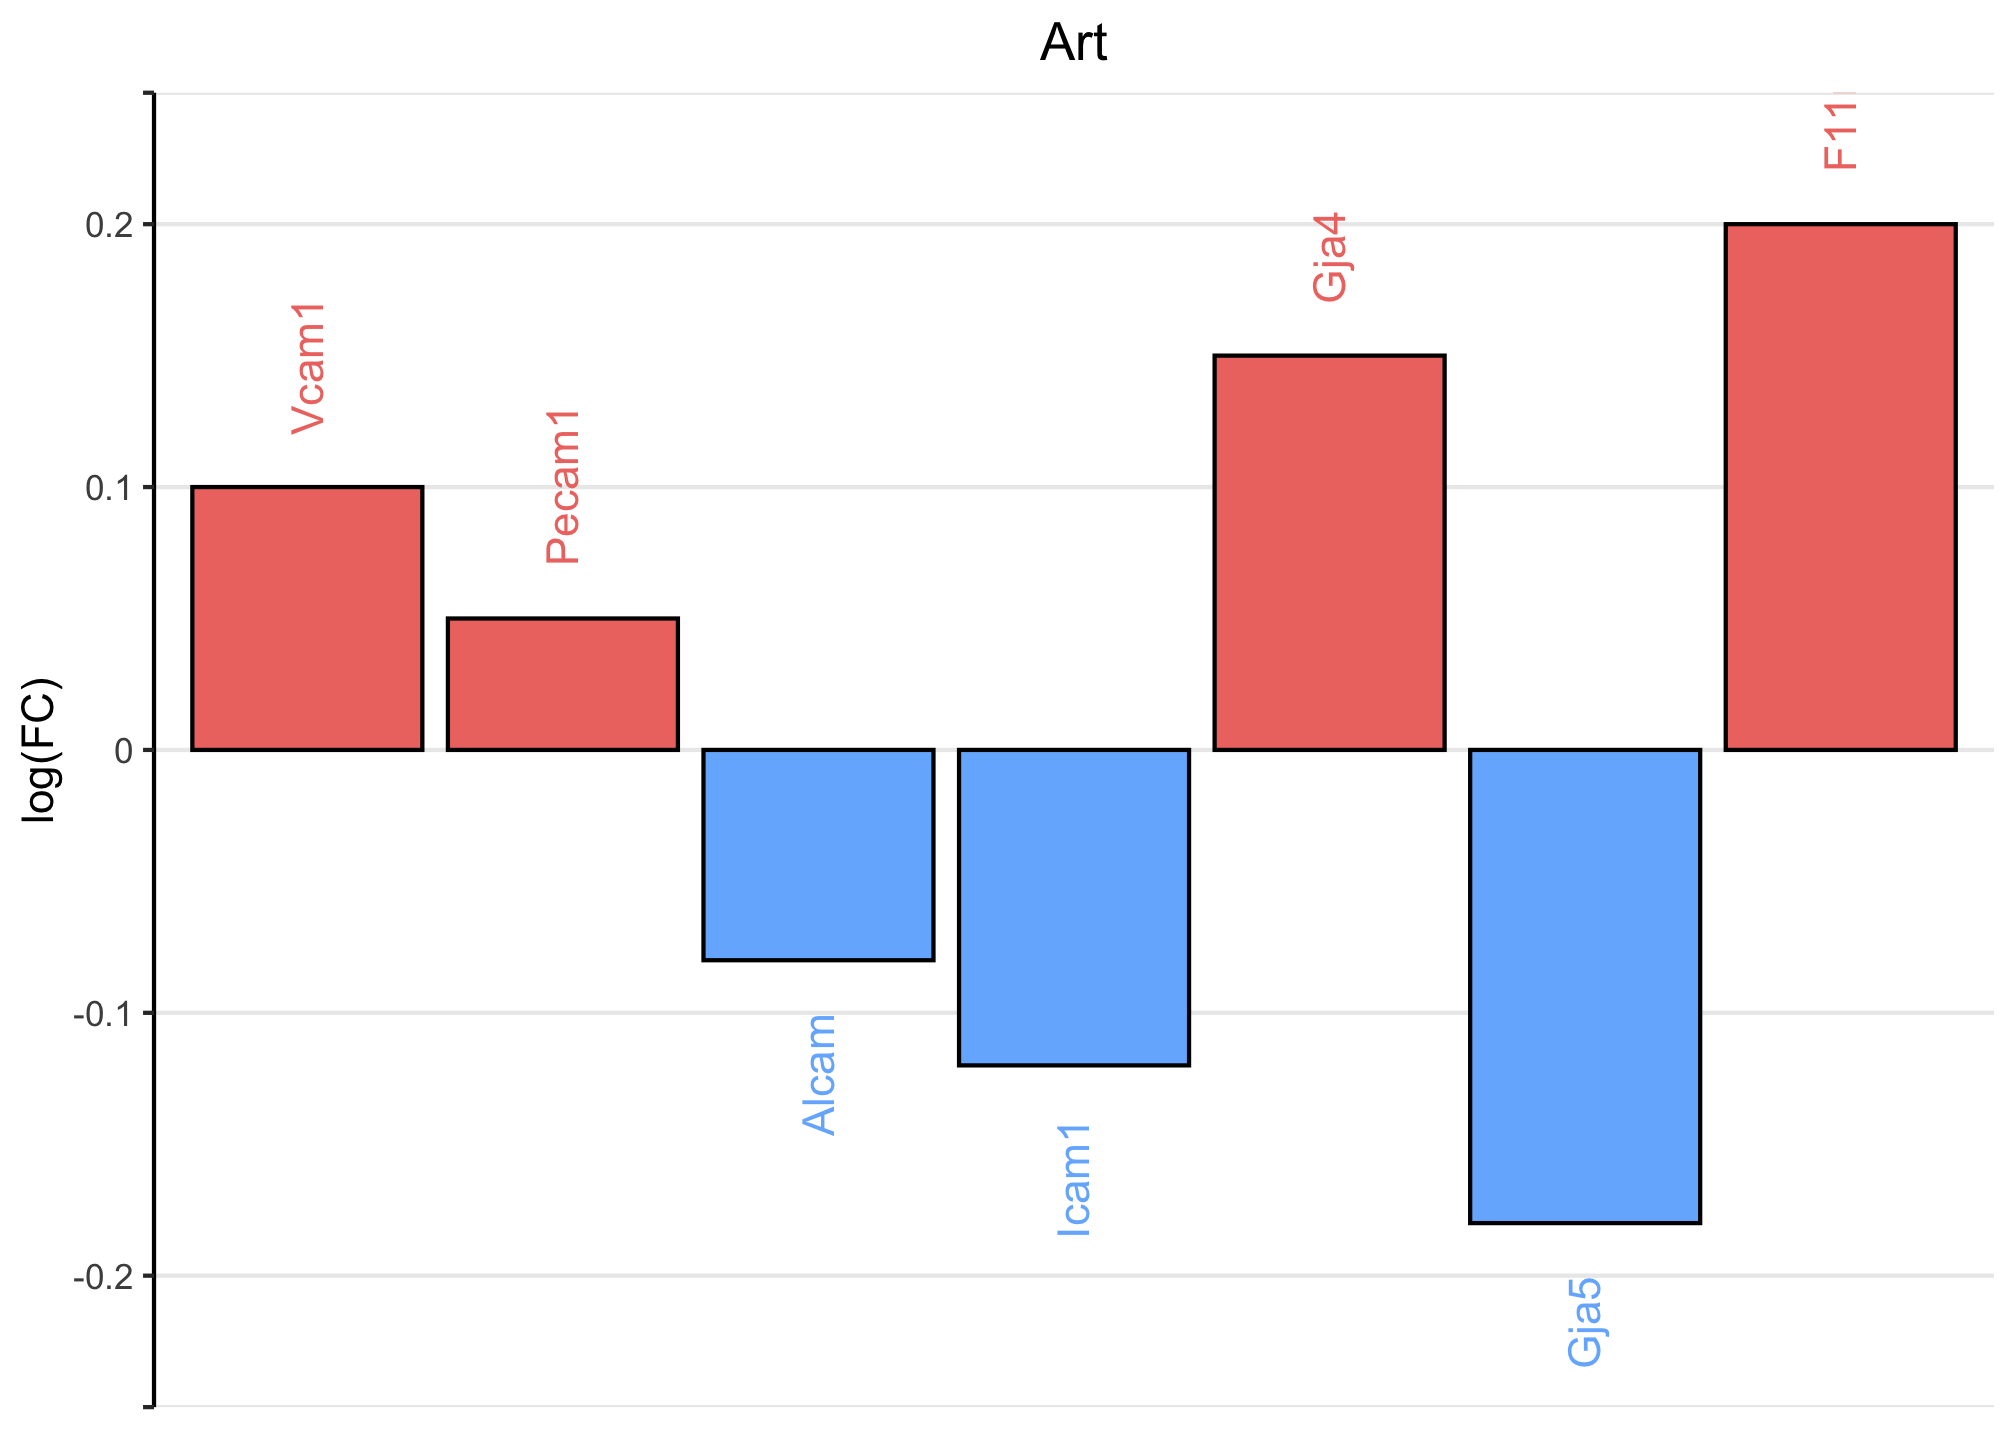
Coloring Negative and Positive Bars Differently using ggplot2
```{r, warning = FALSE, message = FALSE}
library(readxl)
library(tidyverse)

x <- c("Vcam1", "Pecam1", "Alcam", "Icam1", "Gja4", "Gja5", "F11r")
y <- c(0.1, 0.05, -0.08, -0.12, 0.15, -0.18, 0.2)

fig3r.df <- data.frame(x, y)


fig3r.df %>%
  mutate(x=factor(x,levels = c("Vcam1","Pecam1","Alcam","Icam1","Gja4","Gja5","F11r"))) %>%
  ggplot(aes(x, y)) +
  geom_col(aes(fill = ifelse(y < 0, "Negative", "Positive")), color = "black") +
  geom_text(aes(y = ifelse(y < 0, y - 0.02, y + 0.02),
                label = x, color = ifelse(y < 0, "Negative", "Positive")),
            angle = 90, hjust = ifelse(y < 0, 1, 0)) +
  scale_fill_manual(values = c("Positive" = "#ee7770", "Negative" = "#77b5fe"),
                    guide = "none") +
  scale_color_manual(values = c("Positive" = "#ee7770", "Negative" = "#77b5fe")) +
  theme_classic() +
  theme(axis.line.x = element_blank(),
        axis.text.x = element_blank(),
        axis.ticks.x = element_blank(),
        legend.position = "none",
        panel.grid.major.y = element_line(),
        plot.title = element_text(hjust = 0.5)) +
  scale_y_continuous(limits = c(-0.25,0.25),
                     breaks = c(-0.25,seq(-0.2,0.2,by=0.1),0.25),
                     expand = expansion(mult = c(0,0)),
                     labels = c("",seq(-0.2,0.2,by=0.1),"")) +
  labs(x = NULL, y = "log(FC)", title = "Art")
```
## Reference
- <https://r-graphics.org/recipe-bar-graph-color-neg>